
Excel Data Cleaning Before Creating a Dashboard: A Practical Checklist
Check structure, duplicates, dates, categories and missing values before turning spreadsheet data into management reports.

Clean spreadsheet data before designing charts so the dashboard uses consistent records, categories and calculation inputs. Begin by defining what each row represents. Then check structure, duplicates, dates, numbers and missing values while preserving an unchanged source copy.
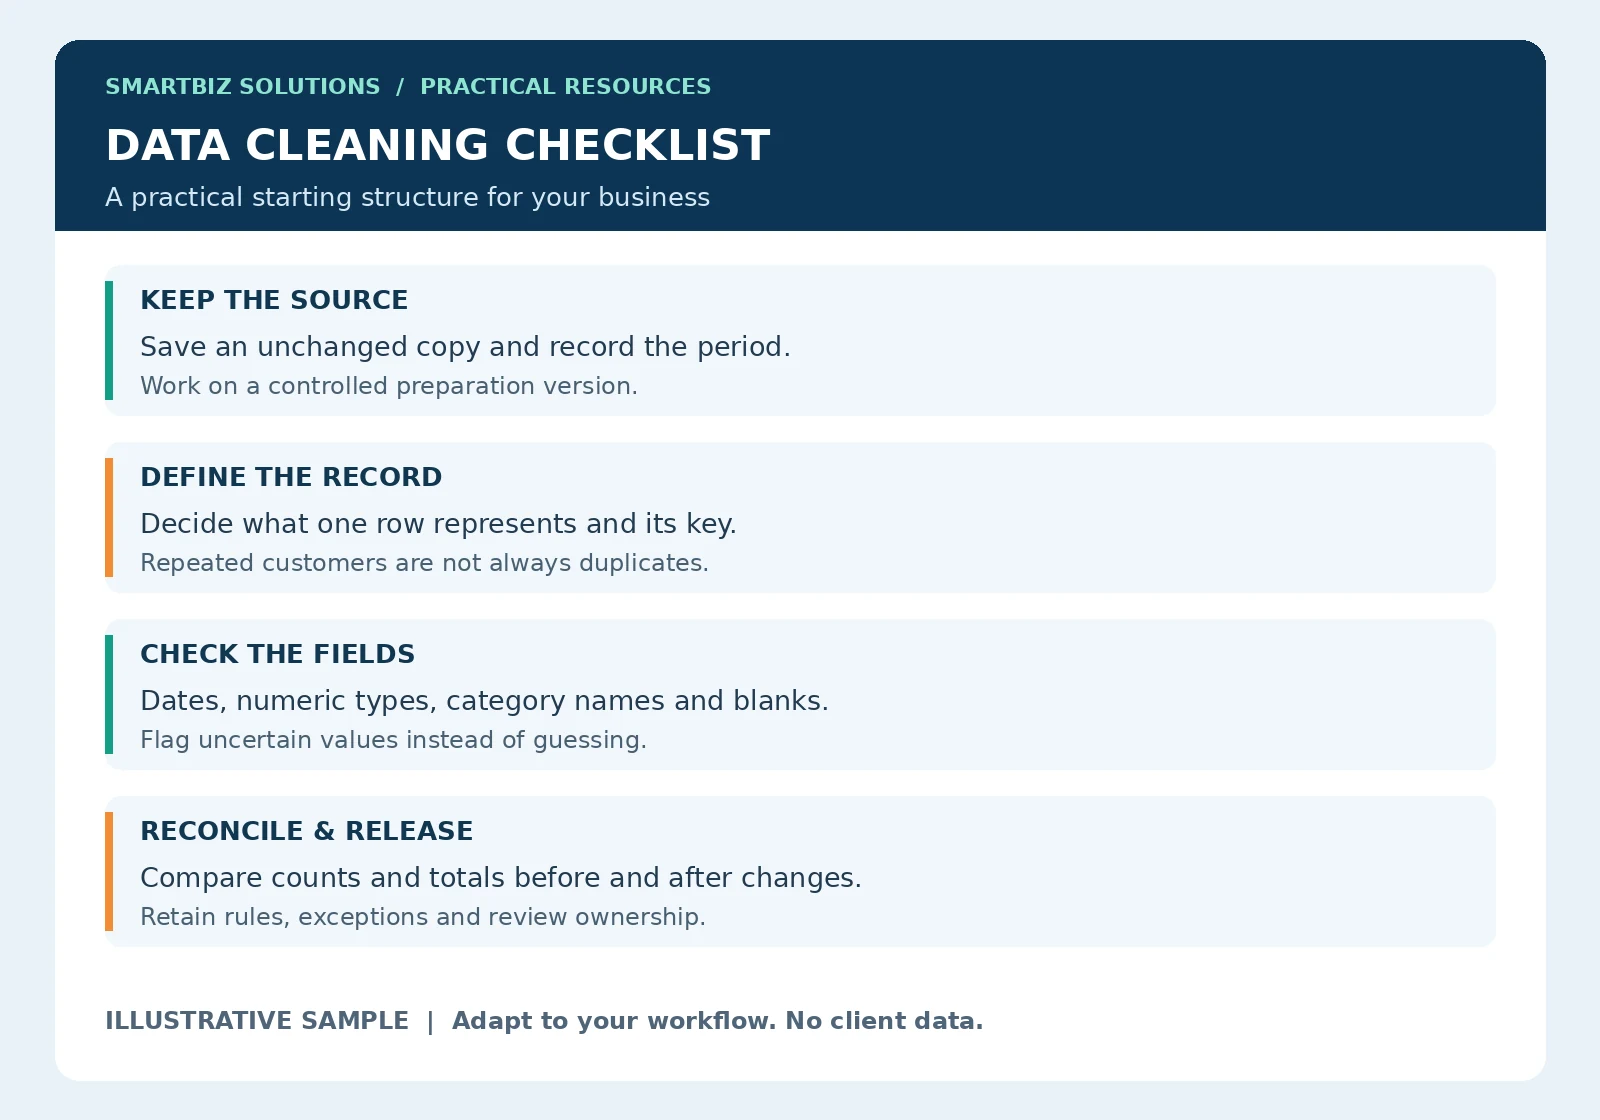
Practical starting point: Adapt the sample to your workflow. Examples are illustrative and do not represent client results.
Keep the original and define the record
Save the original file and record its source and reporting period. Use a separate preparation version for changes. If the source comes from several teams, identify which files and locations are included and which are still missing.
Decide whether a row represents an enquiry, an order, an order line, a daily total or another event. The same customer appearing several times may be valid. Without a row definition, removing repeated names can destroy legitimate activity.
Use a consistent table structure
Give each field a clear heading and keep one type of information in each column. Avoid merged headers, blank separator rows and manually inserted subtotals inside the dataset used for analysis. Keep presentation formatting in the report view rather than relying on it to define the source structure.
If several sheets contain the same type of records, align their column meanings before combining them. A field called “Date” may mean enquiry date in one file and completion date in another. Matching the label alone is not enough.
Investigate duplicates before removing them
Agree the key that identifies a record. It may be a unique reference or a combination of fields. Review apparent duplicates to distinguish a repeated export, a corrected record and a legitimate second event.
Microsoft’s guidance notes that removing duplicates deletes the selected duplicate data. Preserve a source copy and confirm which columns determine a duplicate before using the feature. Document what was removed and why.
Standardize categories without losing meaning
Values such as “In Progress,” “in progress” and “In-progress” may represent the same agreed status. Build a mapping list rather than correcting labels differently each month. Ask the process owner when two terms may have different meanings.
Keep the original field when traceability is important and create a cleaned category alongside it. Do not force an unknown value into a category merely to make a chart look complete; use an exception list for review.
Check dates and numeric fields
A date can look correct while being stored as text. Numeric-looking values may also be text or include inconsistent units. Check how the source stores values and test calculations on representative rows.
For ambiguous dates such as 03/04/2026, establish the intended date convention from the source owner. Changing display formatting cannot reliably tell you whether the original value meant 3 April or 4 March. Separate currency, quantity and percentage fields and label units clearly.
Treat missing values as information
A blank outcome may mean the enquiry is still open, that no outcome was entered or that the field does not apply. Those meanings are different. Agree missing-value rules and identify which blanks prevent a measure from being calculated.
Do not automatically replace every blank with zero. A missing purchase amount is not evidence that nothing was spent. Flag uncertain records and keep their effect visible in the report’s completeness notes.
Illustrative before-and-after review
Suppose a preparation file has 105 rows. A confirmed repeated export accounts for five duplicate records, leaving 100 distinct events. Ten of the remaining records have an unconfirmed status. Your report can show 100 events and 10 status exceptions; it should not silently treat the exceptions as completed work.
Record the rule used to identify the five duplicates and retain the excluded references. This makes the revised total explainable. The numbers are an example of reconciliation, not a recommendation to remove a fixed share of any dataset.
Reconcile before building the dashboard
- Compare record counts before and after each material change.
- Check totals against the source where totals should remain unchanged.
- List excluded records and unresolved exceptions.
- Test date ranges, category filters and calculation denominators.
- Have the responsible owner confirm disputed meanings.
- Retain the preparation rules and review date.
Make repeat preparation easier
Once the rules are agreed, document the sequence or build a repeatable transformation where the available tools support it. A saved process still needs review when source fields or business rules change. Do not assume a successful refresh means the source is complete.
Use the sample checklist above as the preparation handover. Assign a person to resolve exceptions and specify what prevents a report from being released. Build charts after the important definitions and checks are stable.
Frequently asked questions
Can formulas fix all inconsistent data?
No. Formulas and transformations can implement known rules. Ambiguous dates, unclear categories and disputed records may require confirmation from the source owner.
Should we delete unusual values?
Investigate first. An unusual value may be an error or a real event. Keep the reason for any correction or exclusion.
Build reports on a clear foundation
Explore data cleaning and analysis, MIS dashboard development and the dashboard planning guide. Further reading: Microsoft: ways to clean spreadsheet data.
Discuss your requirement on WhatsApp · Download the free MIS workbook and explore reporting-time savings · Back to Insights & Resources