
What Should a Small Business Management Dashboard Show?
Choose useful KPIs, show targets and trends, and make data freshness and follow-up actions clear.

A useful management dashboard shows the few measures a manager needs to make a decision, with a reporting period, a comparison and a clear indication of data freshness. Start with the questions your team must answer. Choose charts and software after the measures and source data are understood.
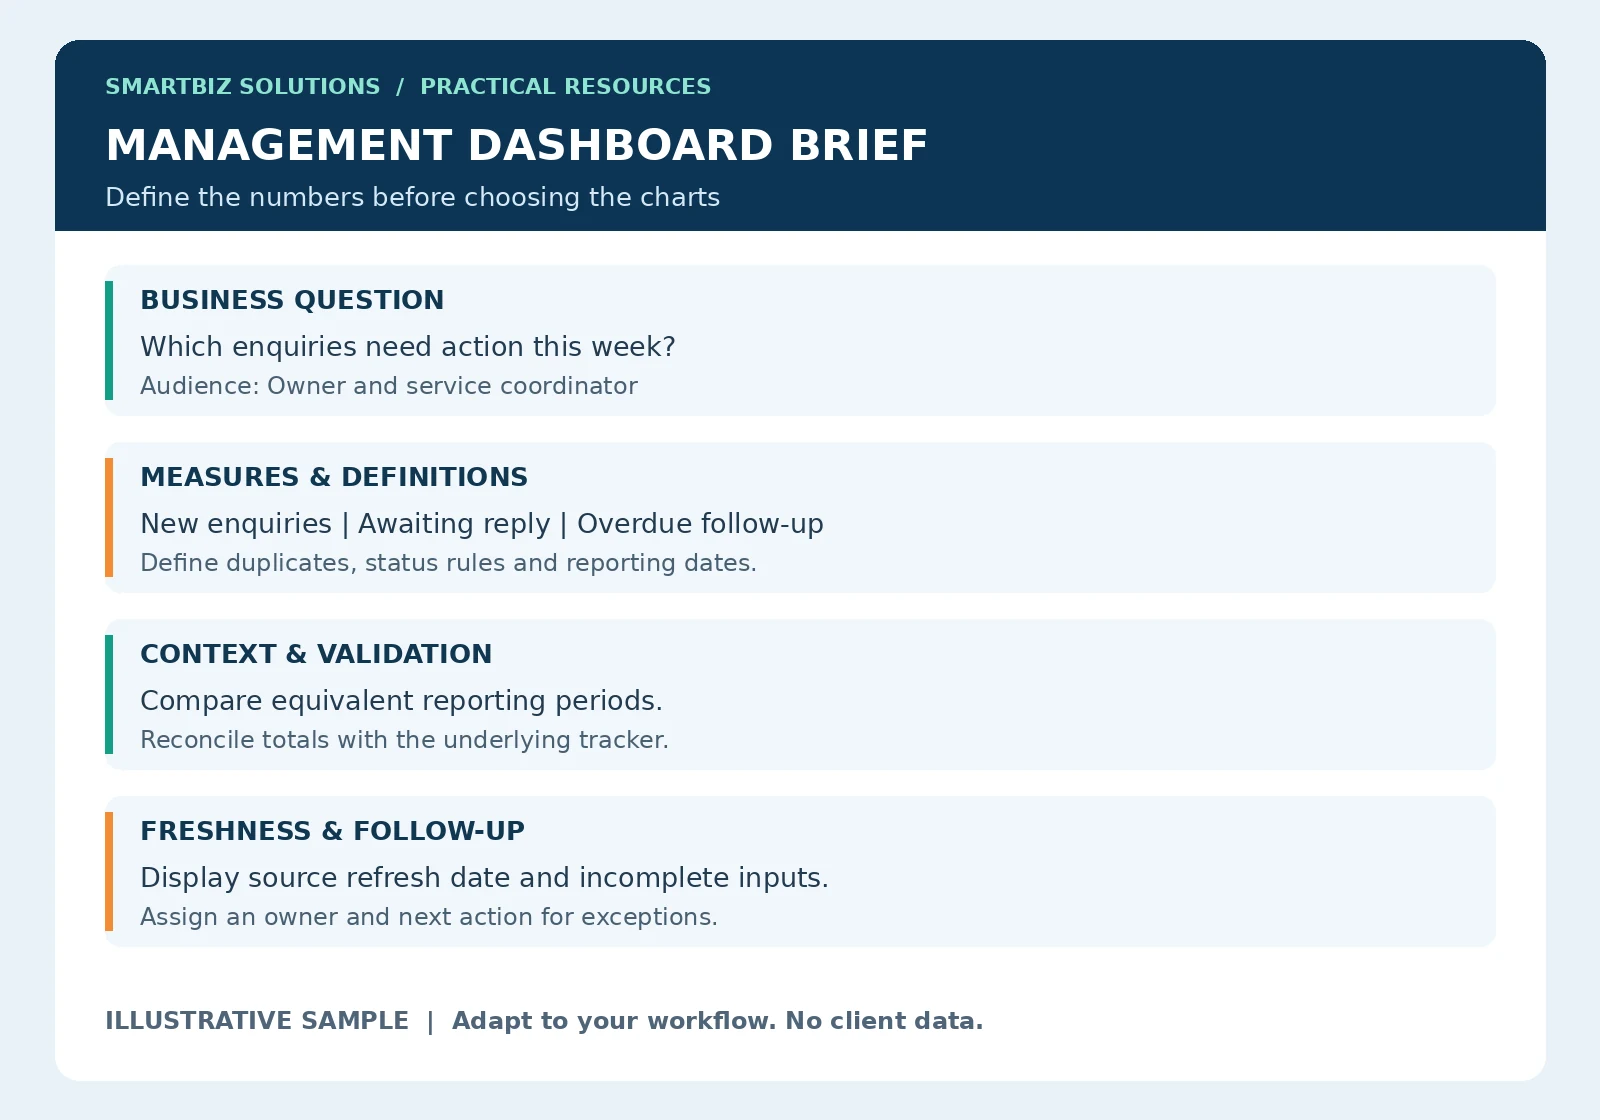
Use the sample as a starting structure. The explanations below show how to adapt it to a real workflow. All numerical examples are illustrative.
Read the dashboard brief before building the screen
The sample brief begins with a question because the same dataset can support very different decisions. “How much work arrived?” requires a count of new work. “What needs attention?” requires status, ownership and due dates. Confirm the question before choosing a summary layout.
Translate the brief into a simple sketch: a heading with dates, a small group of priority indicators, a comparison and an exception list. Show the sketch to the intended user before spending time on colours or interactive features. Ask them to identify the next action from the information displayed.
Worked example: calculate and label a measure
Suppose an illustrative tracker contains 40 distinct enquiries received during a defined week. If 10 of those enquiries still await a first response at the review time, the share awaiting response is 10 divided by 40, or 25%. Label the measure with the enquiry period and the review time so the user understands what the percentage describes.
This is not automatically an overdue-response rate. Overdue requires a separate definition of the agreed response deadline. It is also not a conversion rate. Keep counts and rates connected to their definitions, and show the underlying count where a small denominator could make a percentage misleading.
Plan refresh and handover
Document where the source file is stored, who updates it and what the user should do when a refresh fails. A last-refresh timestamp should describe the source update or successful processing step it actually represents. Opening a dashboard today does not make last month’s data current.
During handover, ask the user to update a sample source, refresh the output and reconcile a total. Include instructions for a new category, a missing field and a changed source format. These practical checks make maintenance needs visible before the reporting process becomes routine.
Start with a decision, not a chart
Ask who will use the dashboard and what they will do after reviewing it. A business owner may need to see overdue enquiries and delivery delays. A supervisor may need a daily workload view. These audiences may need different information, even when both views use the same source records.
Write down the decision beside each proposed KPI. If nobody can explain what action a number supports, consider leaving it out of the first version.
Six things to include
- Reporting period: State which dates the figures cover and whether the period is complete.
- Priority measures: Select indicators relevant to the actual business question.
- Comparisons: Show an agreed target or a comparable earlier period.
- Trends: Help users distinguish a repeated pattern from a single unusual result.
- Exceptions: Highlight items requiring attention, such as overdue work or missing inputs.
- Freshness and ownership: Show when the underlying data was updated and who follows up.
Example: an enquiry dashboard
Consider an illustrative service business tracking enquiries. Its first dashboard could show new enquiries received, enquiries awaiting a response, overdue follow-ups and outcomes recorded. These measures describe different stages and should not be added together as if they were separate customers.
Define what counts as a new enquiry, how repeat contacts are treated and when follow-up becomes overdue. Record the owner and next action in the underlying tracker so the dashboard supports work rather than becoming a separate reporting exercise.
Write a definition for every KPI
For each measure, document its purpose, source fields, calculation, exclusions, reporting frequency and owner. If you calculate an enquiry-to-customer conversion rate, define the enquiry group and how long outcomes are observed. Comparing this week’s enquiries with unrelated sales completed this week can give a misleading result.
Specify how cancellations, duplicates and missing outcomes are handled. Mark incomplete figures as incomplete rather than treating missing records as zero.
Make comparisons meaningful
Compare equivalent periods where possible. A partial current month and a complete previous month do not represent the same amount of operating time. Label the difference clearly or use matched periods. Targets should be approved business expectations, not numbers chosen merely to make the dashboard look complete.
Keep the first version readable
Use consistent labels, units and date formats. Put the most important information where users encounter it first. Use colour sparingly and include text labels so a status does not depend on colour alone. Avoid decorative charts that make straightforward comparisons harder.
Microsoft’s dashboard design guidance also emphasizes the audience and the metrics that help it make decisions. The checklist here is a practical starting structure; it should be adapted to your workflow.
Check the numbers before sharing
- Reconcile sample totals against the source records.
- Test duplicates, blank fields and unusual categories.
- Confirm that filters change the intended measures.
- Check the refresh date after updating the source.
- Ask a user to explain what action they would take from the dashboard.
Frequently asked questions
Should we use Excel or Power BI?
Choose according to data sources, users, refresh needs, sharing arrangements and maintenance. A well-defined Excel report can be a useful starting point; more software does not fix unclear measures.
Does every dashboard need live data?
No. The refresh frequency should match the decision. Clearly state when the figures were last updated and which steps remain manual.
Build a useful first version
Choose one business question, agree a small set of measures and validate a sample before expanding. SmartBiz Solutions supports MIS dashboards and automated reports. For investigating a dataset before deciding what to monitor, explore data analysis services.
Discuss your reporting requirement on WhatsApp · Get free editable templates and use the reporting-time calculator · Back to Insights
Further reading: Microsoft Learn: dashboard design tips.